
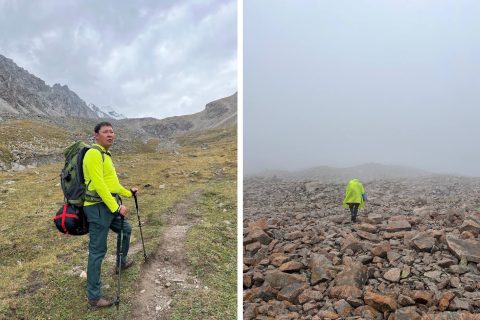
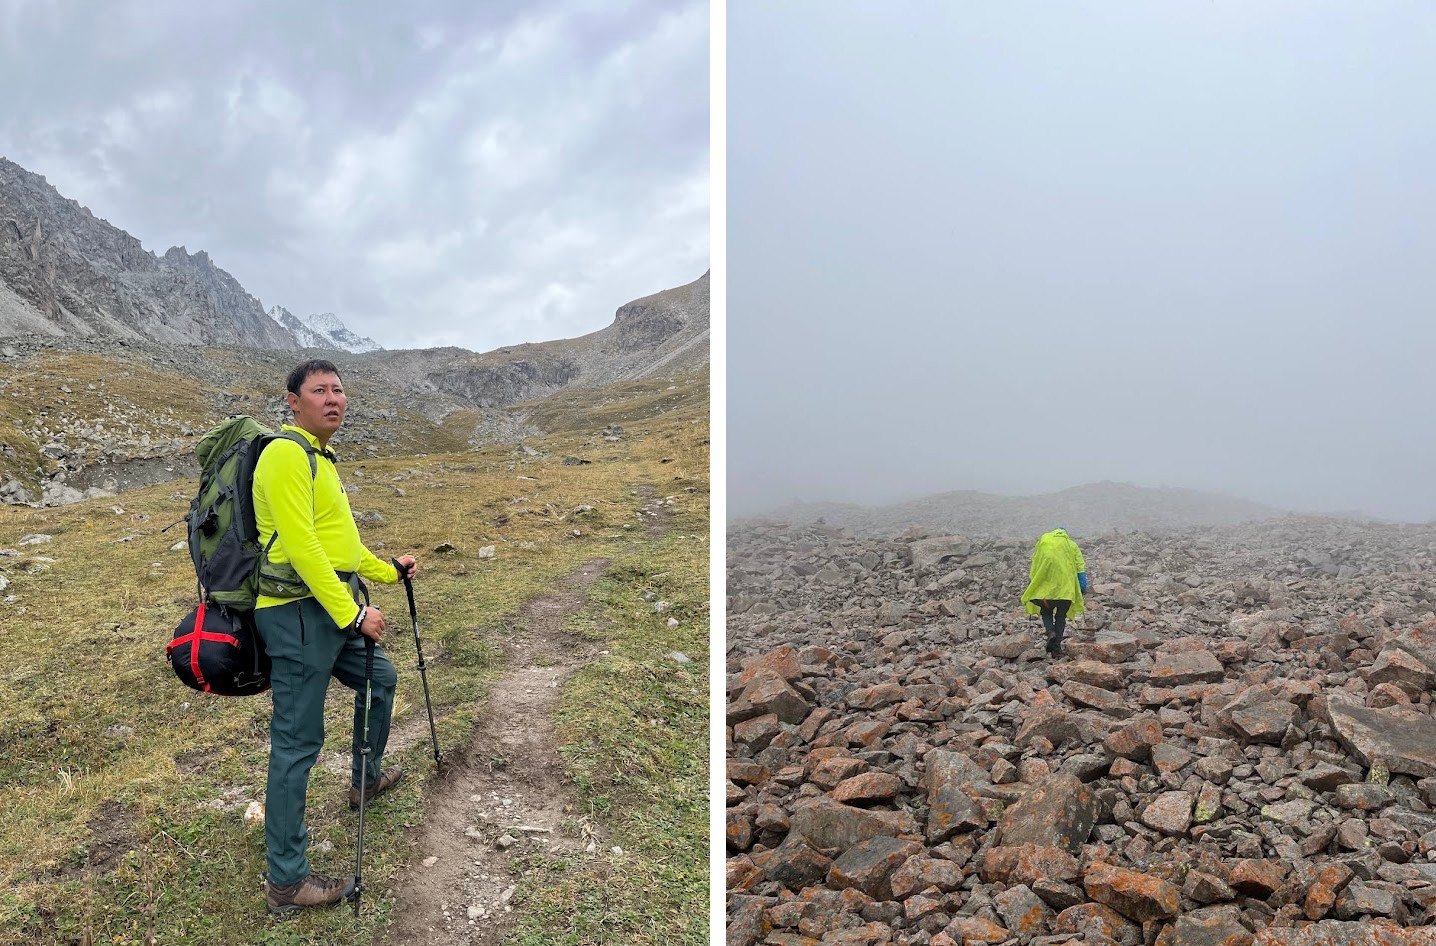
On the route up to the Adygene glacier, above the Ala-Archa gorge, the path crosses the river on foot. In high water those crossings are not safe. The scientists who read the instruments up there make the climb once or twice a week, and on some of those days the river decides whether they go.
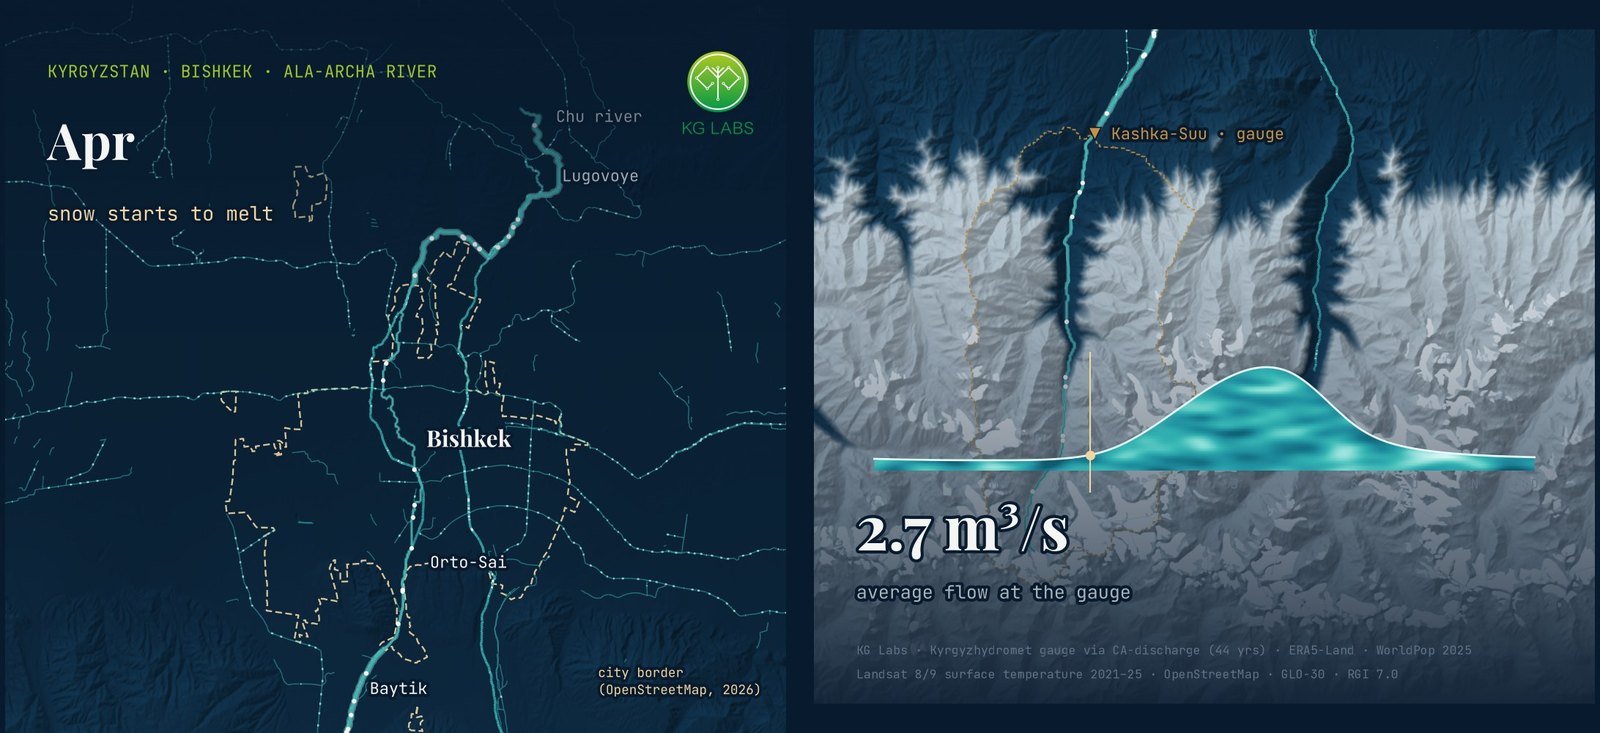
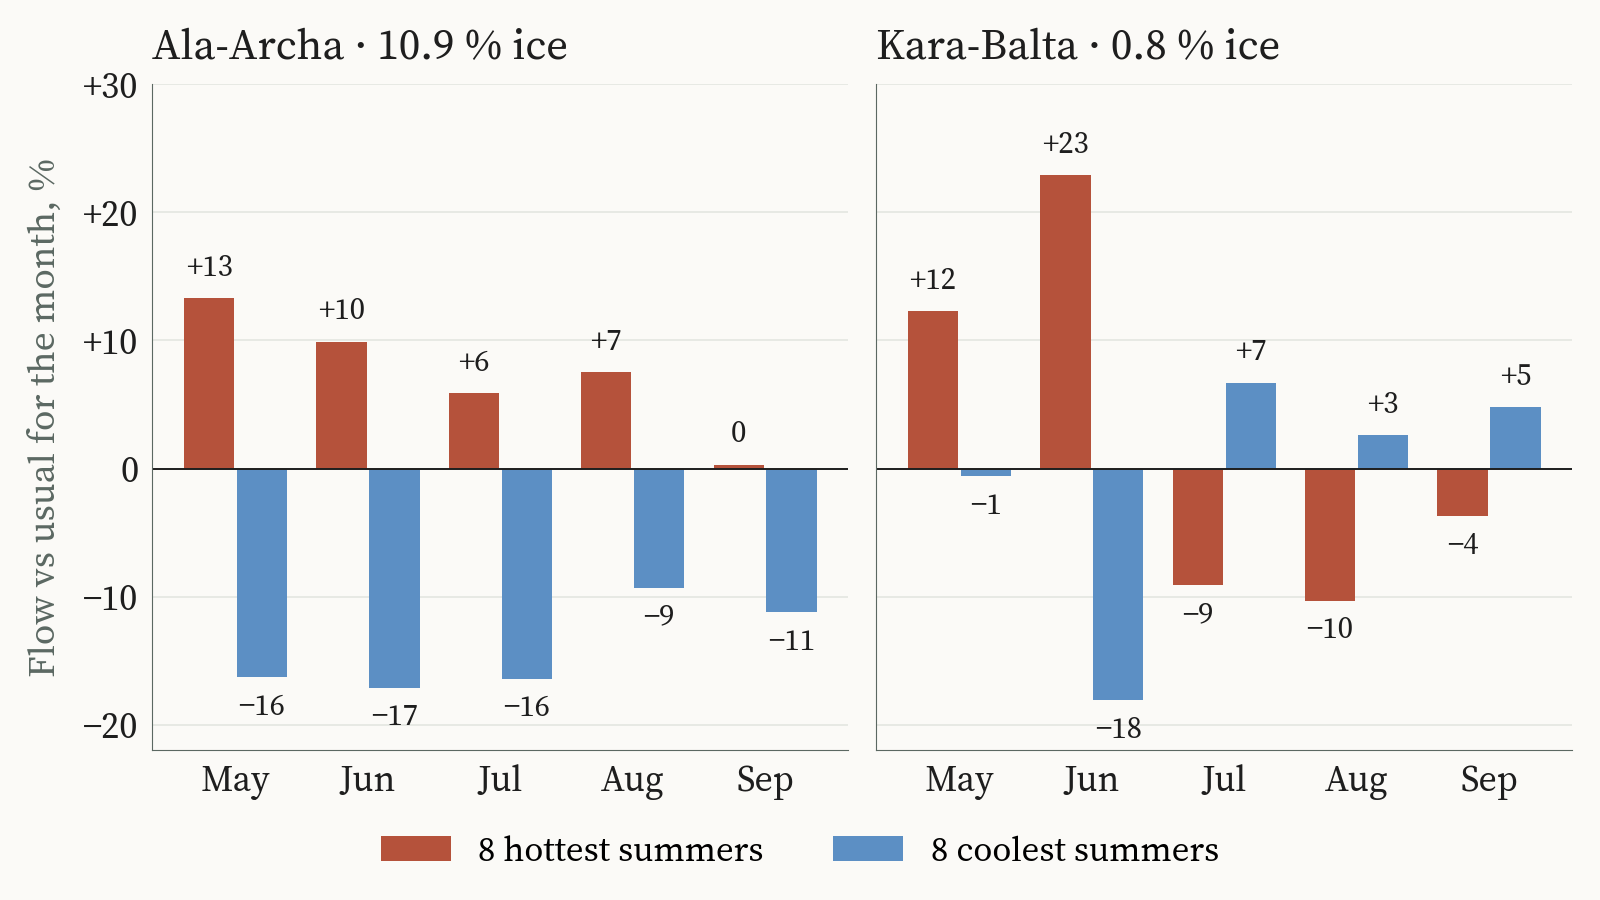
The river runs higher in a hot summer. In the gauge record for the Ala-Archa, the eight hottest summers between 1970 and 2017 carried about 6 per cent more water than usual in July and about 7 per cent more in August. The eight coolest summers carried about 16 and 9 per cent less.
Fifty kilometres west, the Kara-Balta does the opposite. Its hottest summers bring a surge in June, about 23 per cent above usual, and then the river falls away. July runs about 9 per cent below usual, August about 10 per cent below. In its coolest summers the Kara-Balta holds a little more water than usual through July, August and September.
The two rivers drain the same range, under the same summers. About 11 per cent of the Ala-Archa basin above its gauge is glacier ice. On the Kara-Balta it is about one per cent, spread across 62 small glaciers.
Glacier ice in a hot summer
A river fed mostly by snow gets its water from one winter. A hot spring melts that snow early, the river peaks early, and by late summer there is less left to melt. A river with glacier ice in its basin has a second source. In a hot summer the heat reaches the ice, and the ice gives water that took decades to accumulate.
That is why the Ala-Archa holds up in exactly the summers when the Kara-Balta thins. The extra water in a hot August comes from ice that the glacier does not regain.
| River (gauge) | Basin under glacier ice | July, 8 hottest summers | August, 8 hottest summers | August, 8 coolest summers |
|---|---|---|---|---|
| Ala-Archa at Kashka-Suu | 10.9 % | +6 % | +7 % | −9 % |
| Kara-Balta at Sosnovka | 0.8 % | −9 % | −10 % | +3 % |
Monthly river flow compared with each river’s usual flow for that month, in per cent. Summers ranked by the basin’s June–August temperature. Glacier share as recorded for each gauge’s basin in the CA-discharge dataset. Gauge years 1970–2017; the Kara-Balta is compared within the periods before and after its 1987 gauge change. Source: Kyrgyzhydromet yearbooks via the CA-discharge dataset; basin temperature from ERA5-Land; KG Labs analysis, October 2026.
Across the twelve gauges in Chuy, Jalal-Abad and Naryn shown in the atlas, the split is consistent. The snow-fed rivers of Jalal-Abad peak between April and June. The Kara-Balta peaks in June and July. The Chuy rivers with more ice in their basins peak in July and August.
The Kyrgyzstan Water Atlas
The Kyrgyzstan Water Atlas is our attempt to put the records behind these rivers in one place and let them be read together. Weather stations from 1879, 54 of them. River gauges from 1910, of which 24 passed our quality checks. A 10-kilometre climate grid, monthly from February 1950 to September 2026, checked against the stations before we used it. And 14 global climate models on three emission paths, carried forward to 2040.
Laid side by side, the seasons show something that a single annual number hides. Every season is warmer than it was in 1951–1980, and spring has moved the most.
| Season | 1996–2025 vs 1951–1980 | 2016–2025 vs 1951–1980 |
|---|---|---|
| Winter (December–February) | +0.8 °C | +1.3 °C |
| Spring (March–May) | +0.9 °C | +1.6 °C |
| Summer (June–August) | +0.5 °C | +1.0 °C |
| Autumn (September–November) | +0.6 °C | +0.7 °C |
Average air temperature over Kyrgyzstan, difference from the 1951–1980 average. Source: ERA5-Land monthly reanalysis, checked against weather stations (summer differences correlate at 0.78 across 1,679 station-years); KG Labs analysis, October 2026.
A warmer spring is the season that matters most for a snow-fed river. It is when the snowpack goes.
Summer in the mountains
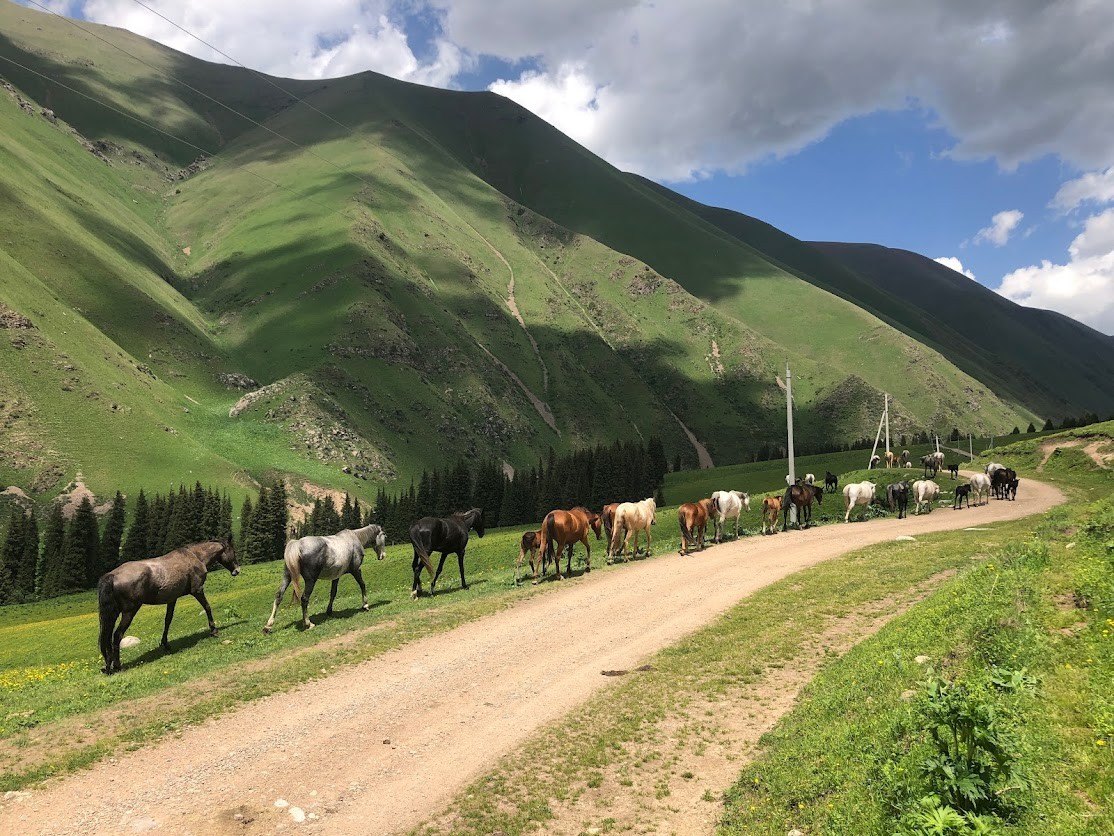
Every summer, when the valleys get hot, people in Kyrgyzstan go up into the mountains. Families from Bishkek move out to their summer cottages, the dachas. Those without one take their families up for a few days of walking in cooler air. It is an old habit, and it had never been measured.
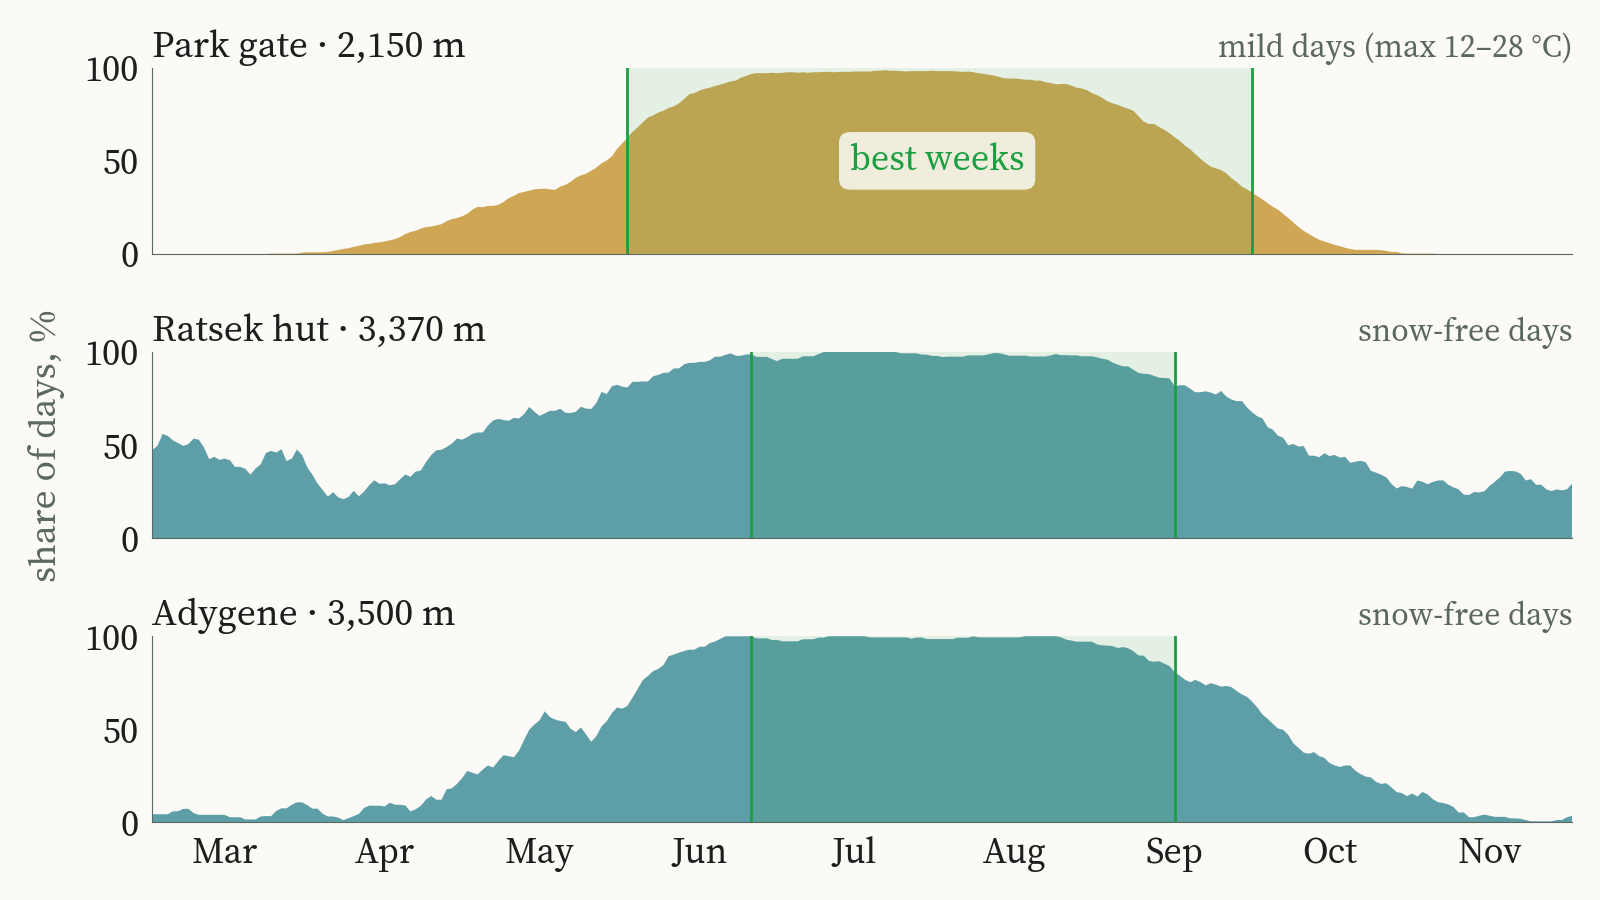
The atlas measures it. In Ala-Archa, the national park 40 kilometres from Bishkek, 75 years of weather and 25 years of satellite snow maps put the season for the park trails at June to September. At the huts of Ratsek, at 3,370 metres, and Adygene, at 3,500 metres, the best weeks run from late June to mid-September. Far to the south-west, in Uch-Korgon on the Isfayramsay, days above 25 °C, which the film calls swimming weather, now begin around 4 May instead of 19 May. The town has about 97 such days a summer, against 87 in 1951–1980, and the climate models put it near 106 by 2040.
People watch their rivers and their weather closely. What reaches them in words is mostly official notices about water levels and changes in irrigation supply. Very little of the record behind those notices has ever been turned into something a family or a farmer can read at a glance. The films and the atlas are our attempt to show how much widely available geospatial data can say when it is drawn plainly.
River peaks and crop needs
Over the past month we published a short film for each of several river valleys, built from the same records. Each one asks the same plain question of a different place. When does the river carry its water, and when do the fields below it need it?
| River | Valley and town | River peaks | Fields need most water | Late-summer flow since 1990 |
|---|---|---|---|---|
| Kugart | Suzak, Jalal-Abad | May | July (plums, walnuts, vegetables) | Drier: short in 15 of the last 27 years |
| Tar | Uzgen, Osh | June | July (rice, apricots, vegetables) | Held steady |
| Talas | Talas | June | July (beans, potatoes, apples) | Held steady |
| Isfayramsay | Uch-Korgon, Batken | July | July (apricots, vegetables) | Not shown in the film |
Peak month from the gauge record for each river; crop water timing from typical crop water needs by month. Late-summer flow compares August–September flow since 1990 with earlier decades. Source: KG Labs river films, October 2026.
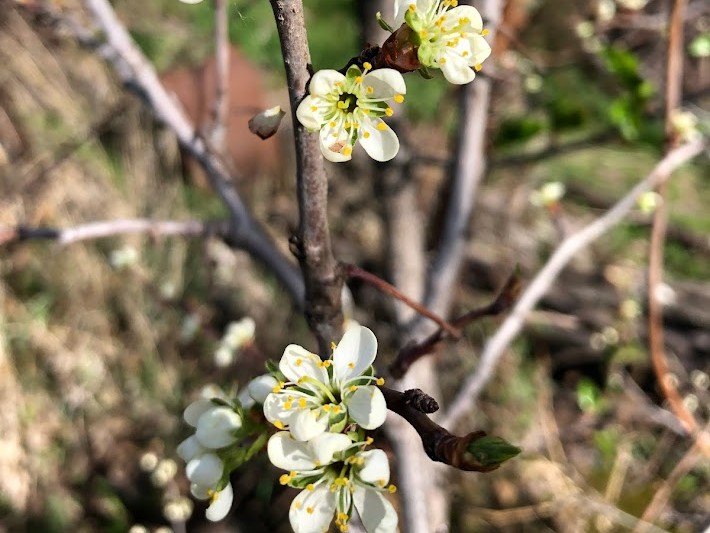
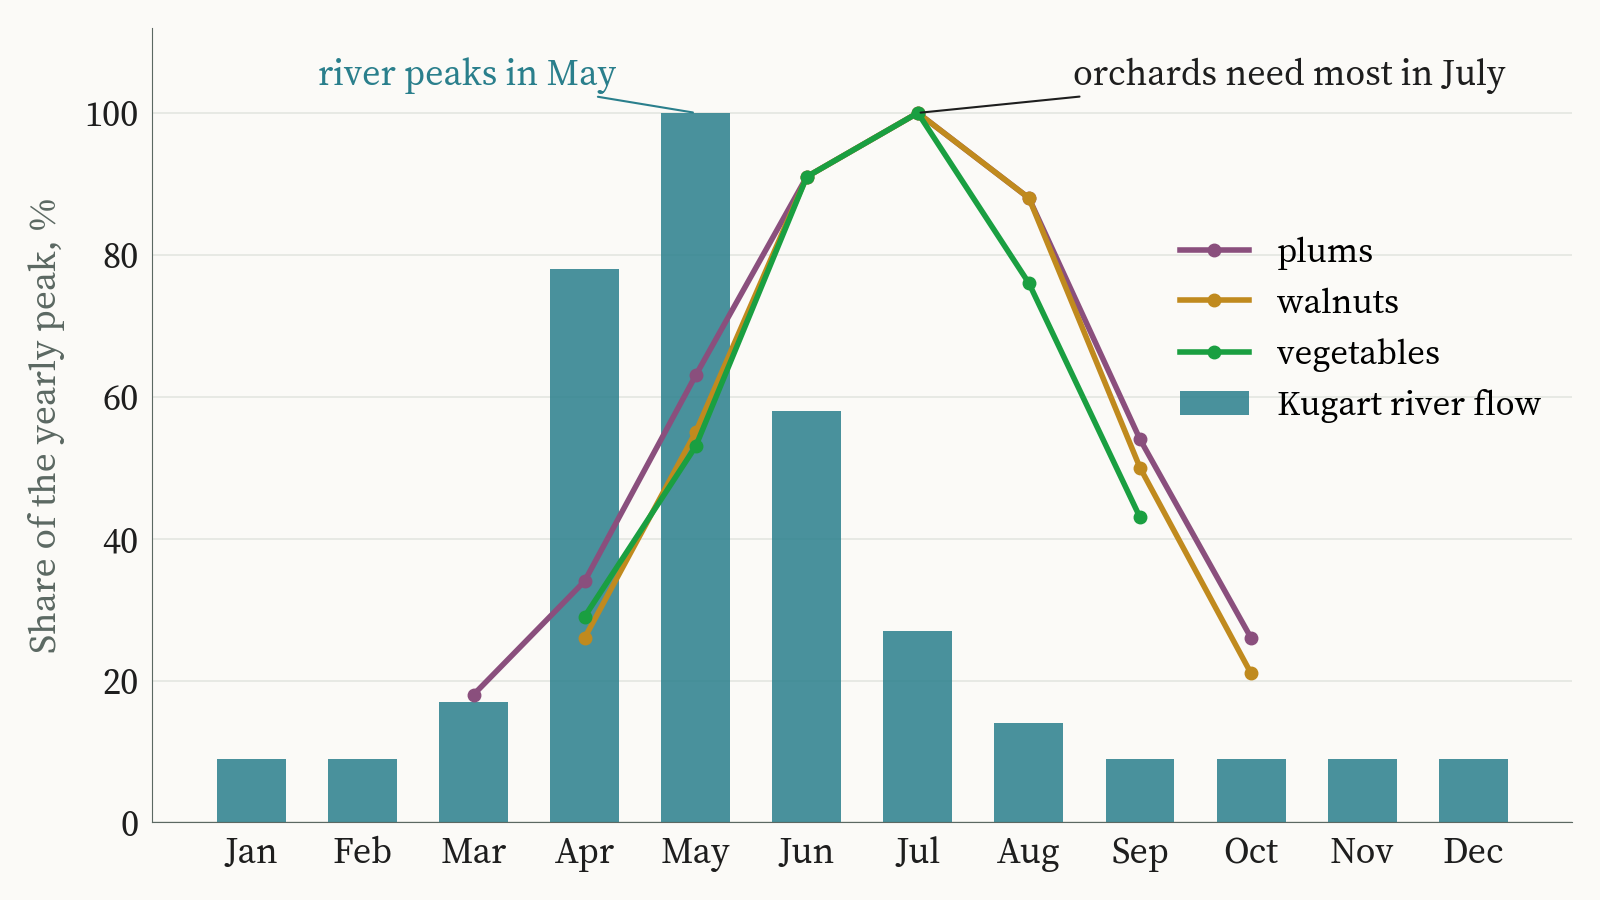
On the Kugart, the river is down to about a seventh of its May flow by August, while the plum orchards of Suzak still need water through the month. Winter snow in the mountains above has not shrunk. The water arrives earlier, or more of it is taken upstream before it reaches Suzak, and the gauge alone cannot say which.
On the Tar, by August the river carries about half its June flow, and the paddies of Uzgen still need water standing in them. On the Isfayramsay the river peaks in July, when the orchards need it most, and the gap opens in August.
In each of these valleys the tight weeks come in late summer. How tight they get depends on when the snow goes, how much ice sits above the river, and how much is drawn off before the water reaches the fields.
Knowing those weeks before the season starts is where smart irrigation begins. In my view it begins with the satellite and climate records that already cover every valley, read well enough to plan a season’s water. Sensor networks in the canals and fields come after that, for planning that is more precise than the records alone allow.
Limits of the atlas
Three things are missing from the atlas.
There is no river-flow projection to 2040, for two reasons. The first is data. Since 2025 the official river datasets in Kyrgyzstan have been classified and are no longer publicly available, and the gauge records we could use end in 2017. A projection needs recent river measurements to stand on, and the country’s own are now closed. The second is the model. The glacier model we tested responds to a warm summer about twice as strongly as the glaciers that have actually been measured. A model that overreacts that much would draw a confident line for the Ala-Archa, and we had no way to stand behind it, so the rivers stay uncoloured in the projection years.
Rain and snow are shown with less confidence than temperature. The climate grid follows wet and dry years closely, but over decades it drifts wetter than the rain gauges at the same sites. On the map, each year’s precipitation is compared with its own surrounding thirty years instead of a fixed baseline, so the drift does not show up as a wetter country. For the future, the climate models disagree on the direction of precipitation change in most seasons, and the atlas shows that disagreement as it is.
Some gauge records break. The Kara-Balta gauge changed in 1987, and a change of instrument or site can look exactly like a change in the river. Wherever a test found a break in a record, that gauge is compared only with itself on each side of the break. A changed gauge is not a climate trend, and a drifting rain record is not a wetter climate.
The Ala-Archa and Kara-Balta pattern is familiar wherever farms depend on mountain rivers, across Central Asia and well beyond it. In Chuy it plays out at the scale of two neighbouring valleys. What the Kyrgyz record adds is its length, with river gauges from 1910 and stations from 1879 to set against a satellite-era climate grid.
Ala-Archa and Kara-Balta in a hot August
In a hot August the Adygene crossings are harder to make, and the Kara-Balta runs lower than usual. Both come from the same heat. On the Ala-Archa side the difference is made up by ice, and that is the ice the global glacier models count down year by year in an earlier piece on the station at Adygene.
The atlas can show how the two rivers have answered heat for half a century. It cannot yet show what the Ala-Archa does in a hot August once the ice that pays for it is gone, and that is the question the next season of measurements at Adygene is meant to help answer.
Aziz Soltobaev · KG Labs Public Foundation · Bishkek, 27 October 2026
Sources: ERA5-Land monthly reanalysis (Muñoz-Sabater et al. 2021, Copernicus Climate Change Service); CMIP6 climate models (14 models, SSP1-2.6, SSP2-4.5, SSP5-8.5); weather stations from Williams & Konovalov (2008), NSIDC G02174; river discharge from Kyrgyzhydromet yearbooks via CA-discharge (Marti et al. 2023, CC BY 4.0); HydroBASINS and HydroLAKES; Copernicus GLO-30 elevation, from which KG Labs traced the river network; glacier outlines from RGI 7.0. The full atlas is at kglabs.org/kyrgyzwateratlas.
Also in: Русский